
Climate Change in the Northeastern United States
(using the 3 km Horizontal Resolution Climate Projections I created)
(using the 3 km Horizontal Resolution Climate Projections I created)
.Below are some highlight figures obtained from my analysis of the high-resolution climate projections I created for the Northeastern U.S . The projections are generated through dynamical downscaling of climate projections from an Earth System Model under a high-impact scenario (RCP 8.5) using a regional climate model (WRF).
Please refer to the main paper describing the dataset for details including model evaluation and citation purposes:
Komurcu, M., Emanuel, K. A., Huber, M., & Acosta, R. P. (2018). High‐resolution climate projections for the northeastern United States using dynamical downscaling at convection‐permitting scales. Earth and Space Science, 5. https://doi.org/10.1029/2018EA000426
The dynamically downscaled, High Resolution Climate projections I created for the Northeastern U.S. are available from the UNH Data Discovery Center: http://ddc-wrf.sr.unh.edu/about/project_description/
Please refer to me if you intend to use the dataset for climate risk applications. (All regional climate model input, output and restart files for re-creating climate projections or performing further downscaling studies are also publicly available).
Please refer to the main paper describing the dataset for details including model evaluation and citation purposes:
Komurcu, M., Emanuel, K. A., Huber, M., & Acosta, R. P. (2018). High‐resolution climate projections for the northeastern United States using dynamical downscaling at convection‐permitting scales. Earth and Space Science, 5. https://doi.org/10.1029/2018EA000426
The dynamically downscaled, High Resolution Climate projections I created for the Northeastern U.S. are available from the UNH Data Discovery Center: http://ddc-wrf.sr.unh.edu/about/project_description/
Please refer to me if you intend to use the dataset for climate risk applications. (All regional climate model input, output and restart files for re-creating climate projections or performing further downscaling studies are also publicly available).
Present Day= 2006-2020 Mid-Century=2041-2060 End of Century=2081-2100
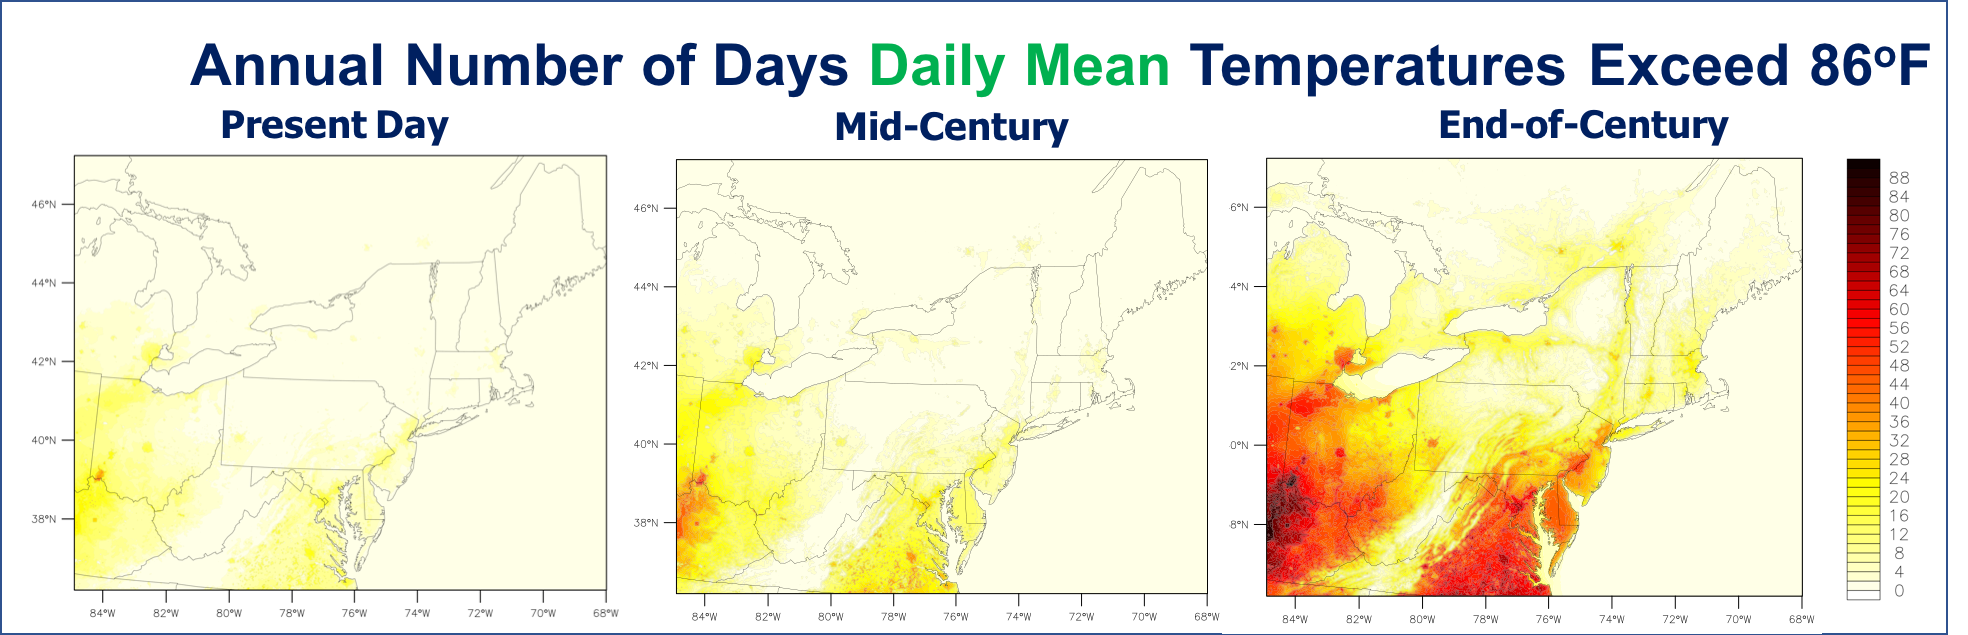
This plot tells us that # of days we experience mean temperatures of 86°F will increase per year.
- In Boston, the annual number of days daily mean temperatures exceed 86°F increases from 3 (present day) to 22 (end of century).
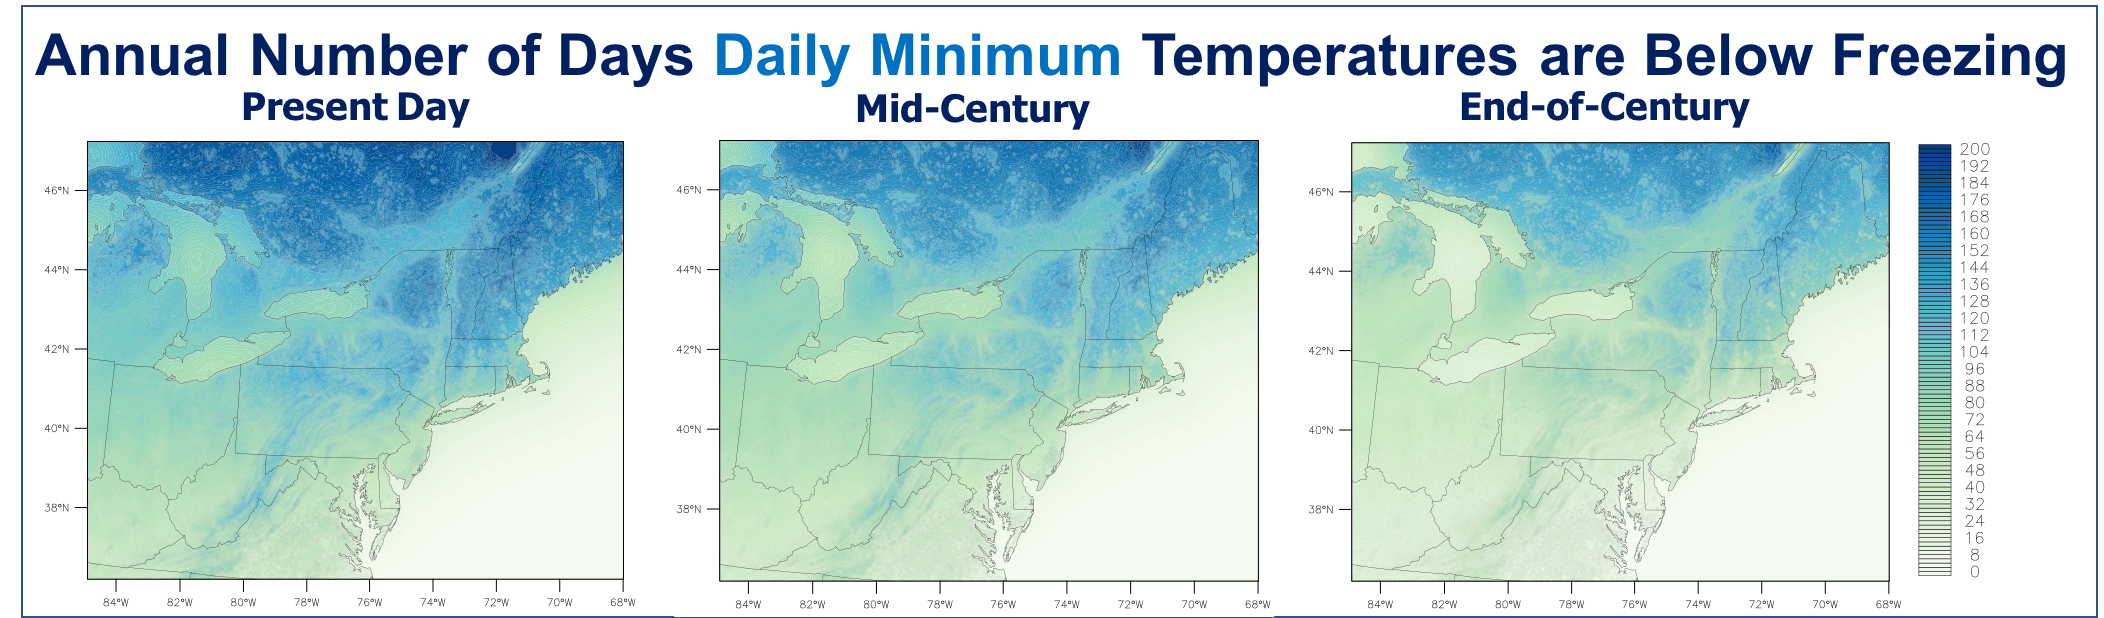
This plot tells us that # of days minimum temperatures will reduce below freezing will reduce per year.
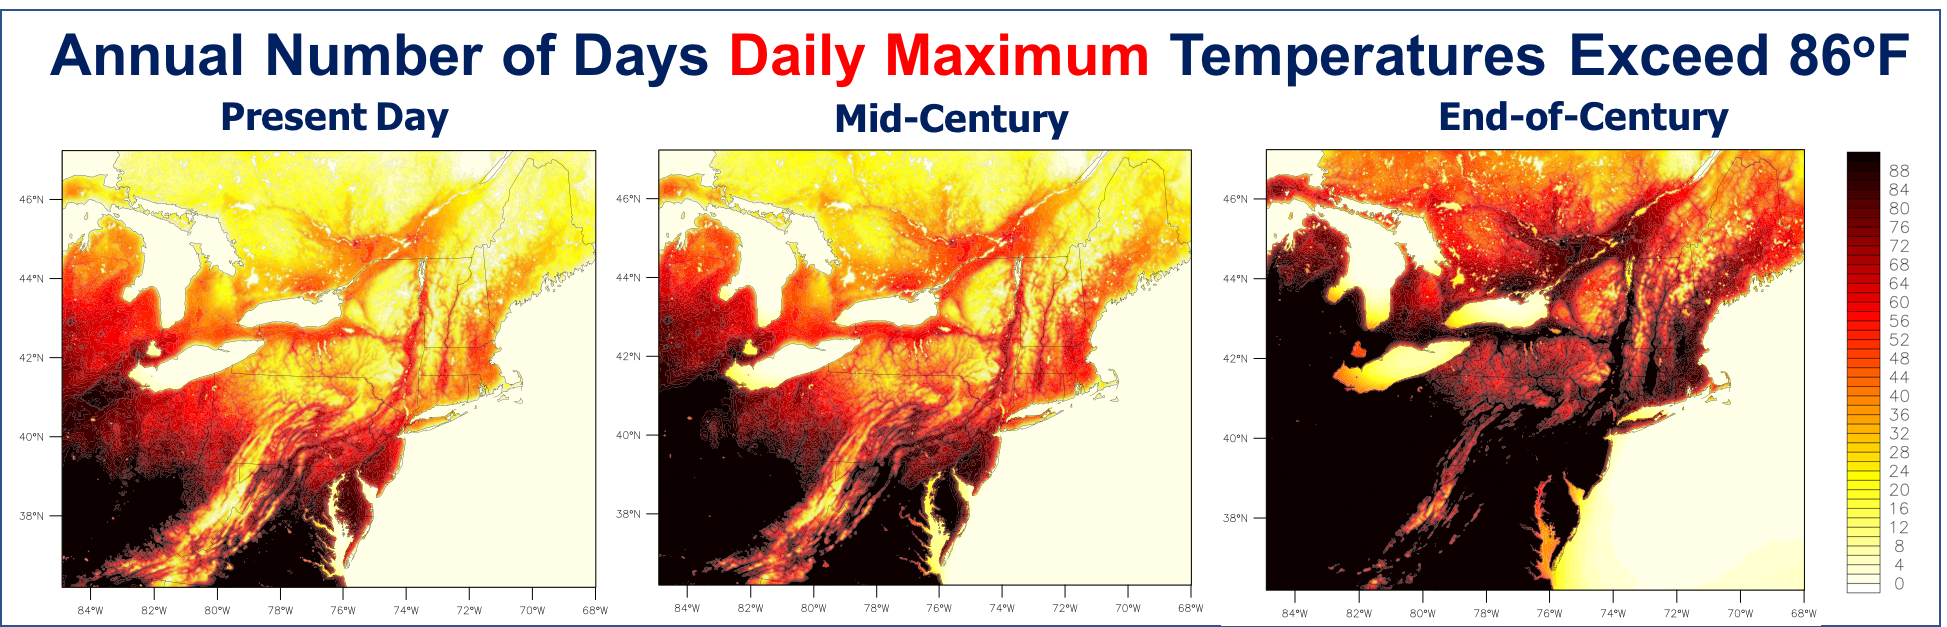
This plot tells us that # of days daily maximum temperatures will increase above 86°F will increase per year.
- In Boston, the number of days the daily maximum temperatures exceed 86°F increases from 49 (present day) to 78 (end of century).
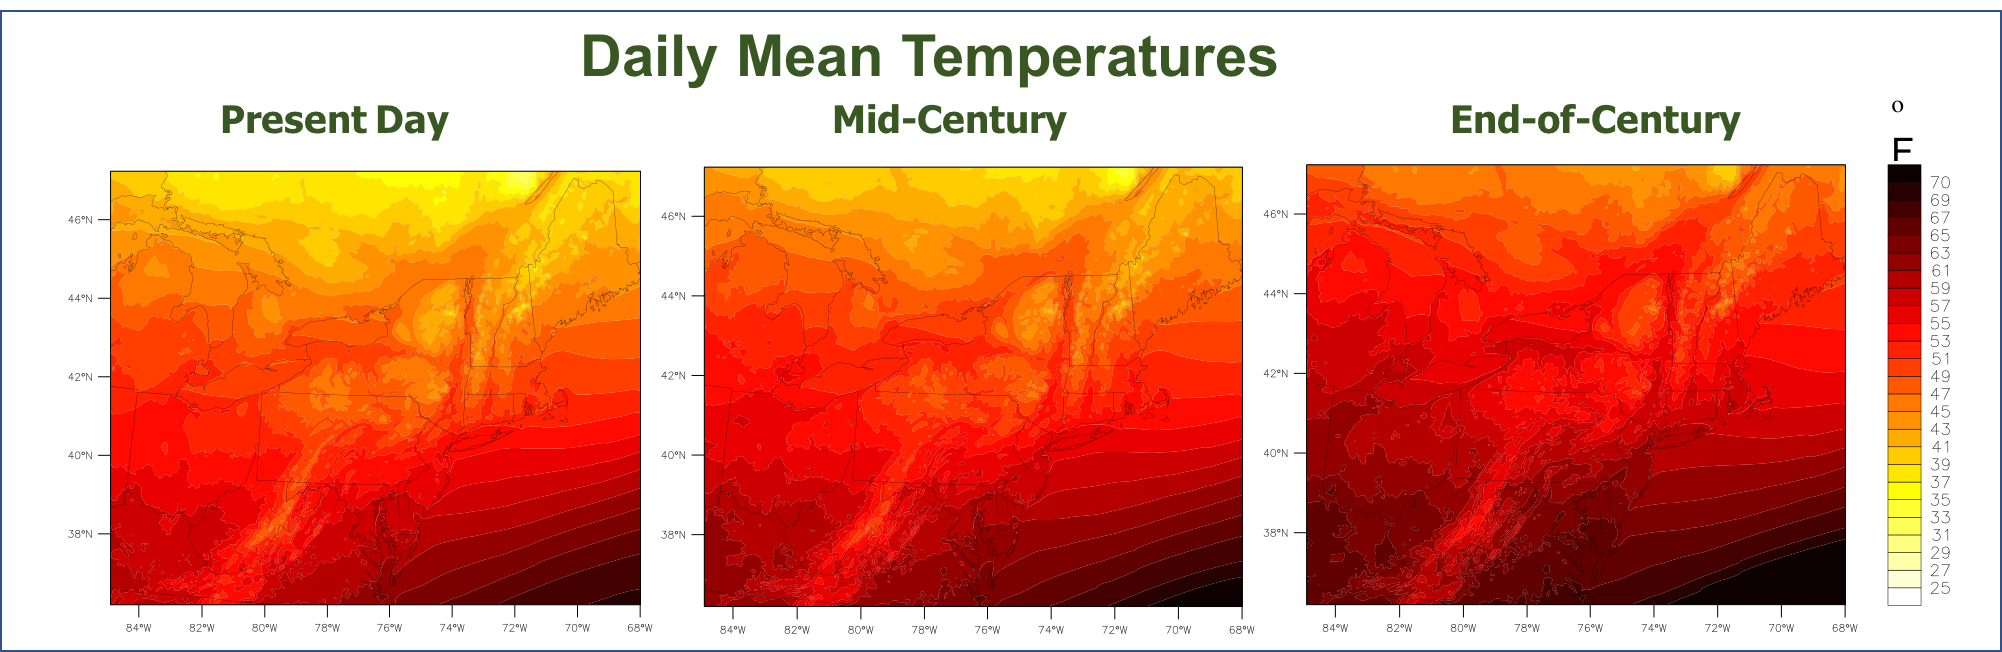
This plot shows us how simulated temperatures daily mean temperatures look over the Northeastern U.S. for present day, mid-century and end of century time periods. Model suggests warming into the future.
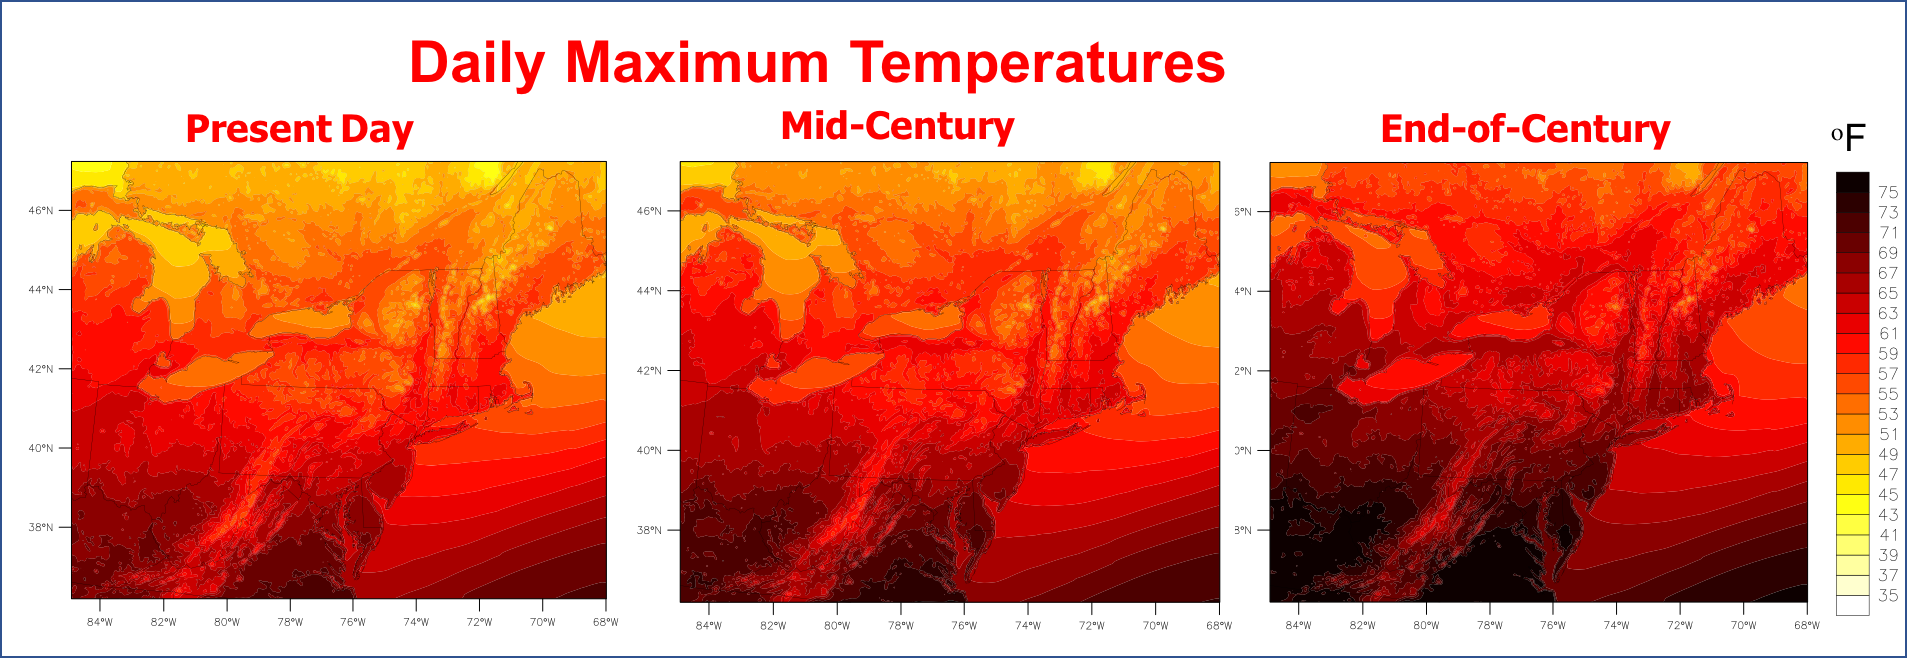
This plot shows us how simulated temperatures daily maximum temperatures look over the Northeastern U.S. for present day, mid-century and end of century time periods. Model suggests increase in daily maximum temperatures.
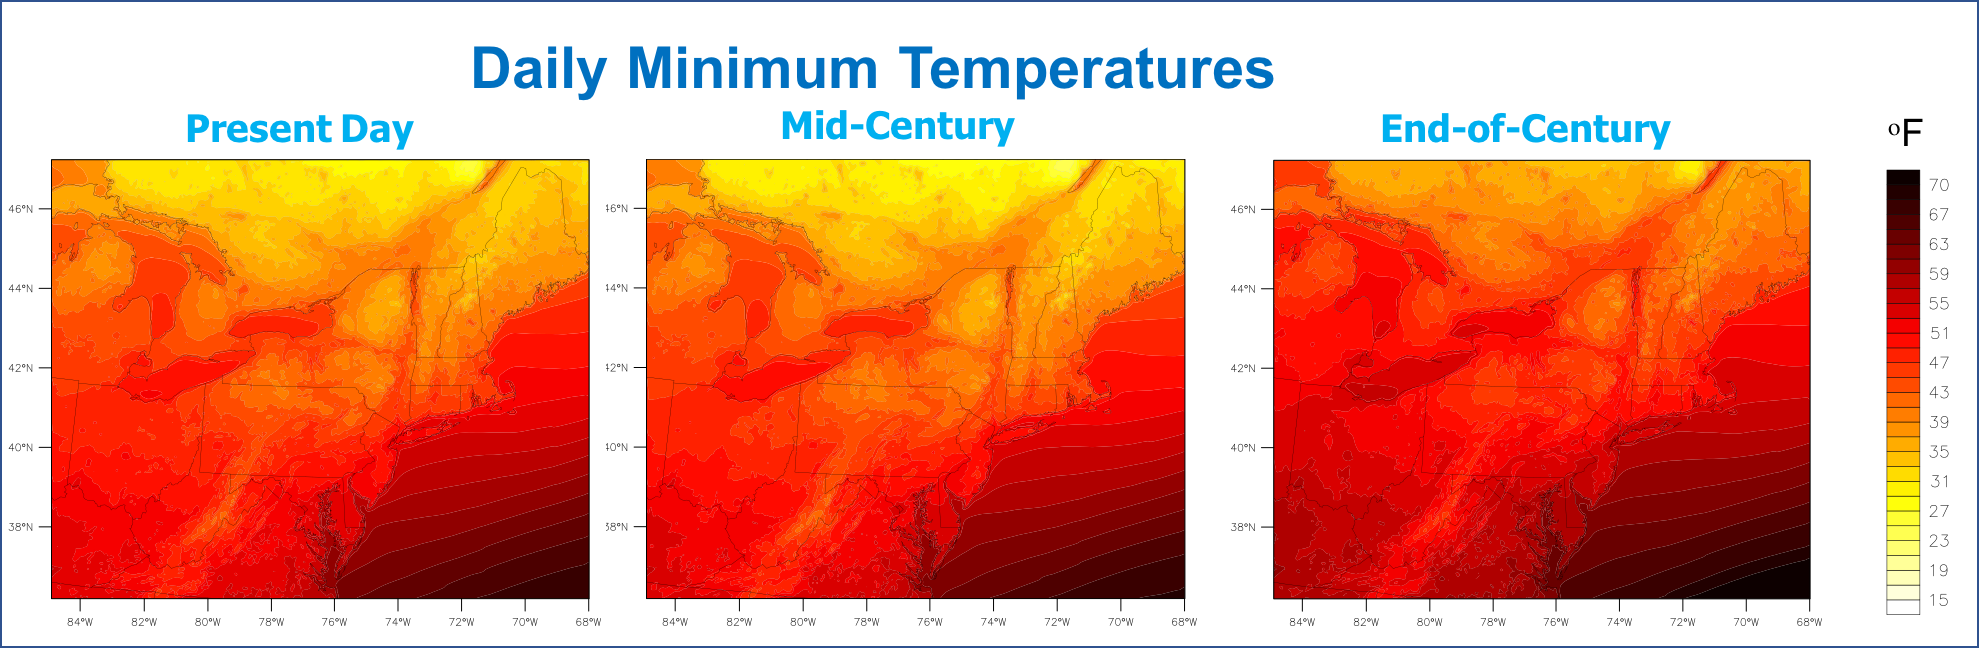
This plot shows us how simulated temperatures daily minimum temperatures look over the Northeastern U.S. for present day, mid-century and end of century time periods. Model suggests future minimum temperatures will not reduce as much as they did daily in the present day climate.
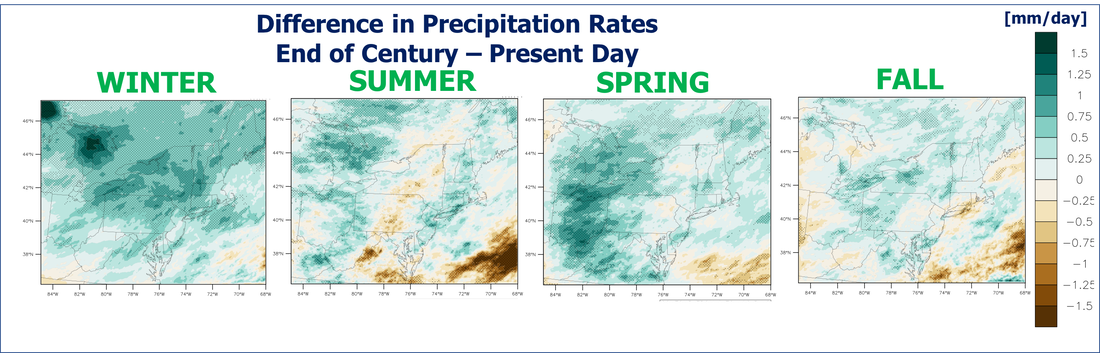
This plot shows us how daily precipitation rates will change in each season during the end of century compared to present day rates as simulated in our high-resolution projections.
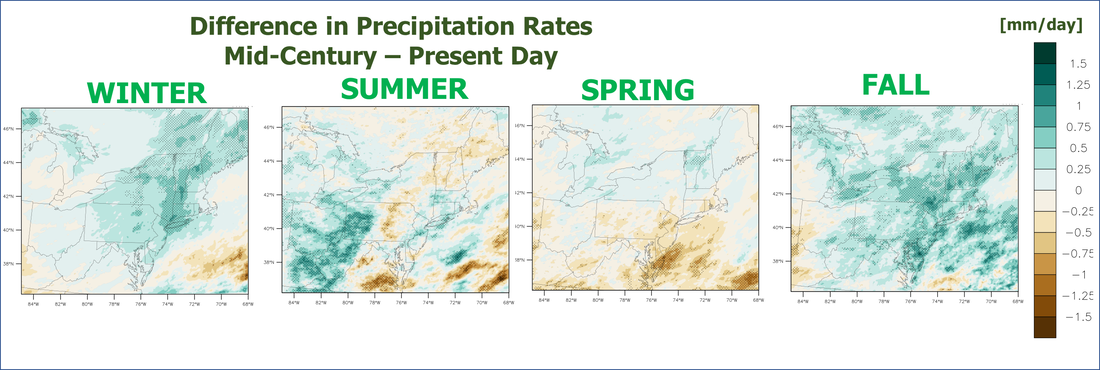
This plot shows us how daily precipitation rates will change in each season during the middle of this century compared to present day rates as simulated in our high-resolution projections.